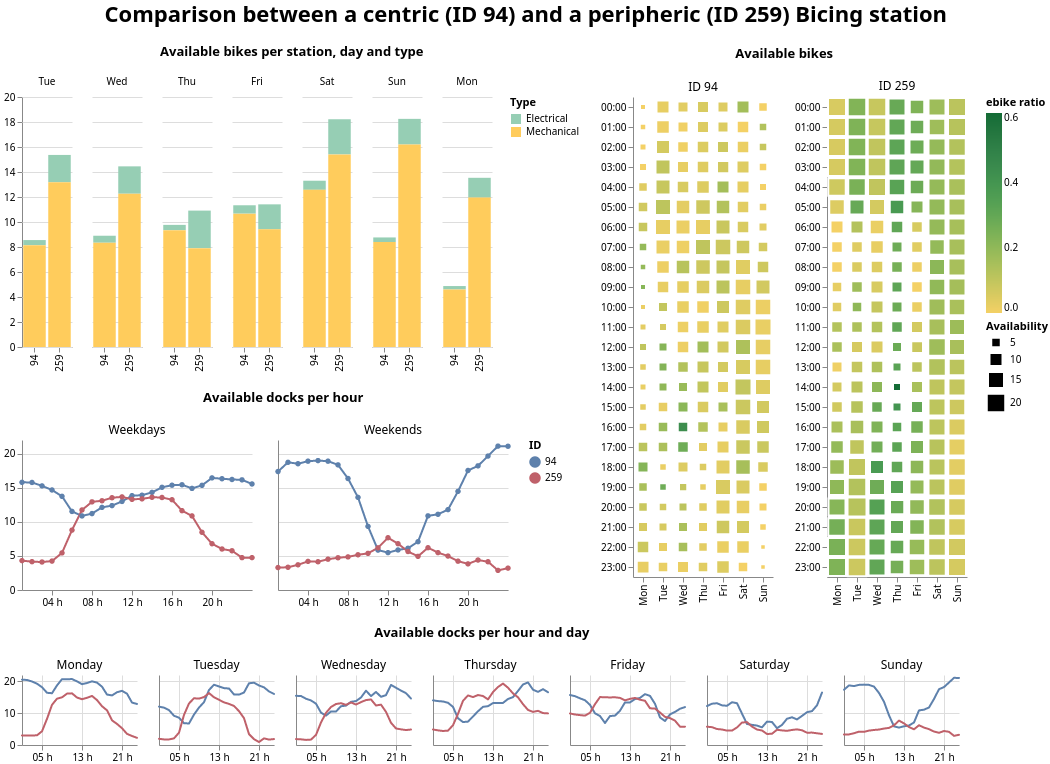
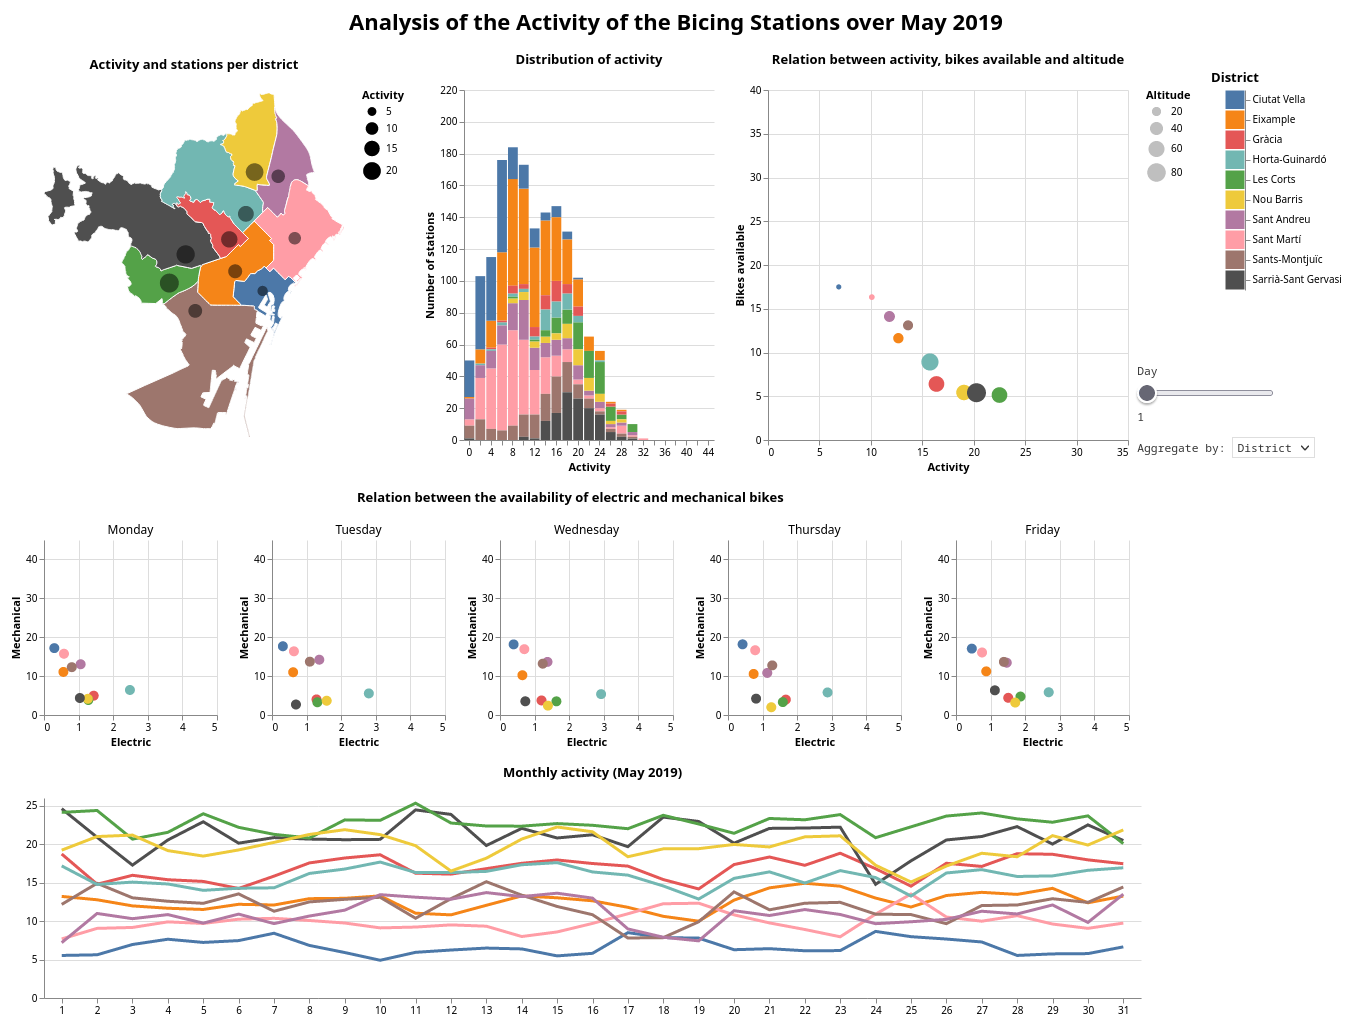
A visualization of historical data from Barcelona’s bicing system.
Part 1
Comparison of a centric and a peripheric station. Using hourly data from the two stations, it shows the availablity of bikes during the day and week.

Part 2
A collection of interactive charts that display aggregated data from all of Barcelona’s stations, with added geographical information.
