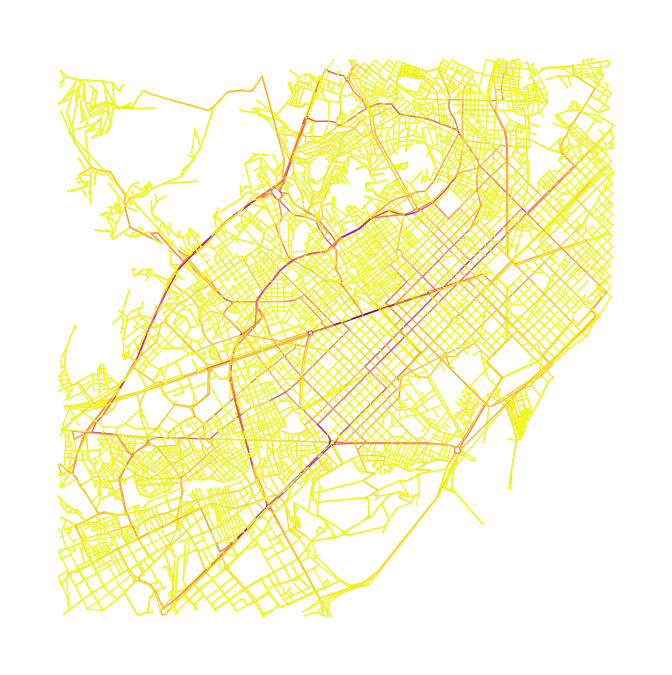
A set of tools for visualizing and managing air pollution in Barcelona due to traffic congestion.
It finished in a close second place in the Datathon FME (The Barcelona Challenge), a 48h data science competition held in UPC’s School of Mathematics and Statistics. The challenge was to use Barcelona’s open data to tackle the well-known problem of pollution in the city.
Our project was split into three different ‘subprojects’, each developed by a different team member.
1. Data analysis to determine the source of the problem
Anxo Lois Pereira’s part.
Processing the data we realized that – ignoring metheorological factors such as rain and wind, that the city administration has no control over – motor traffic is one of the major causes of air pollution (surprise!).

2. Interactive visualization of the data
Raúl Higueras’ part.

We developed a web-based interactive dashboard that allows visualizing the air pollution measured in every street in the city for every day of the year (for as many years as the original data set contained) and every hour of the day.
Some unsurprising patterns arose: weekends were usually less prone to pollution and rush hours regularly showed distinct peaks.
Overlaying the traffic data over a map of the city we saw that at rush hours some of the main avenues are heavily congested (as anyone from Barcelona already knows…) and it coincides with the spots that show the most pollution.
3. Tool to help solve the problem
My part!
Since it felt a bit rude to point out the problem without offering a solution (and 2 days of competition looked like plenty of time when project-planning at the beginning), we decided to spend some resources (i.e. me) on this part of the project, somewhat independent from the other two, under the idea that “if we get it working, we’ll win this competition; if not, we’ll still have some decent project to present”.
So the idea was the following: an interactive tool that simulates car traffic in the city and allows to perform modifications in the street layout. Essentially, a platform for testing future projects and how it might improve/worsen the traffic flow.
The intention originally was to code a fully-featured simulation with cars as individual objects, with predefined routes (e.g. from home to work and back), traffic lights, car queues, etc. A bit like what I did in a [previous project]({{ ‘/projects/hashcode.html’ | relative_url }}). But we quickly realized that, not only would this be extremely challening to code in such a limited amount of time, but it would be computationally unfeasible to run a simulation in a city-wide scale, with millions of individuals.
The alternative we came up with was to manage the city layout as a graph and make use of highly-optimized modules such as NetworkX to obtain an approximation of the traffic flow through heuristics, such as the edge betweenness centrality. While this was relatively straightforward to code, it had severe limitations, such as ignoring that population is not uniformally distributed across the city.

So we decided to ditch the previous implementation and take another approach: a Monte Carlo simulation of traffic routes in the city. Essentially, we pick two “random” points in the city (origin and destination of a single person) and compute the shortest path (the route we expect the person to take); after doing this enough times we can get a sufficiently accurate picture of the traffic flow with a given city layout.
In this original version we are essentially computing an estimation of the edge betweenness centrality, so not much is gained. Except that this new method is much more flexible and allowed us to add the following features:
- Use real demographic data (again, from Barcelona’s open data and OpenStreetMap) to distribute the population more accurately over the territory, instead of following a uniform distribution ( e.g. depending on the time of day we can increase the probablity that a route is from a residential area to an industrial one). As a side note, we learned the hard way that there are thousands of different coordinate systems and managing multiple datasets with geographical data quickly becomes a mess…
- On top of changing the city layout by adding/removing streets or changing the direction, it is easy to modify other parameters such as the maximum speed of a street.
- The simulation can be biased at will to account for knowledge not present in the original data. E.g. we know that at rush hours there are lots of cars in the main avenues entering the city from outside.
While this approach still has some flaws (the most important being that routes are computed independently and there is no interaction between individuals, such as car queues or waiting at intersections), it is very scalable and versatile.