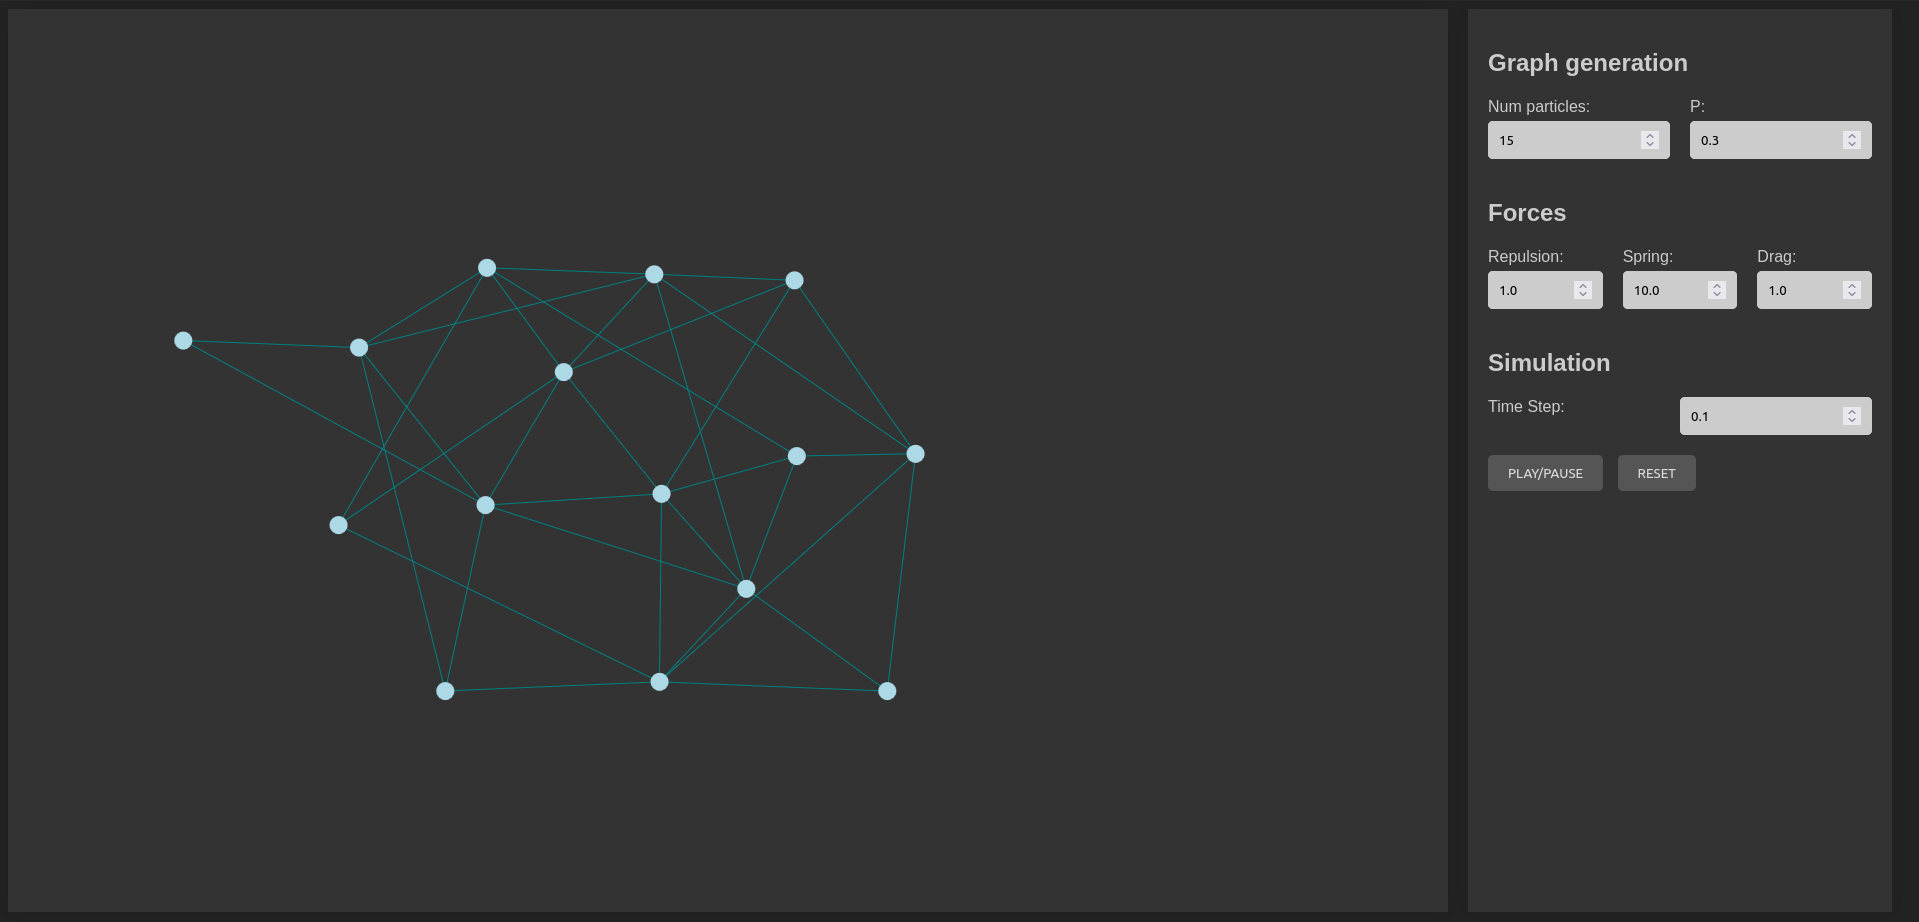
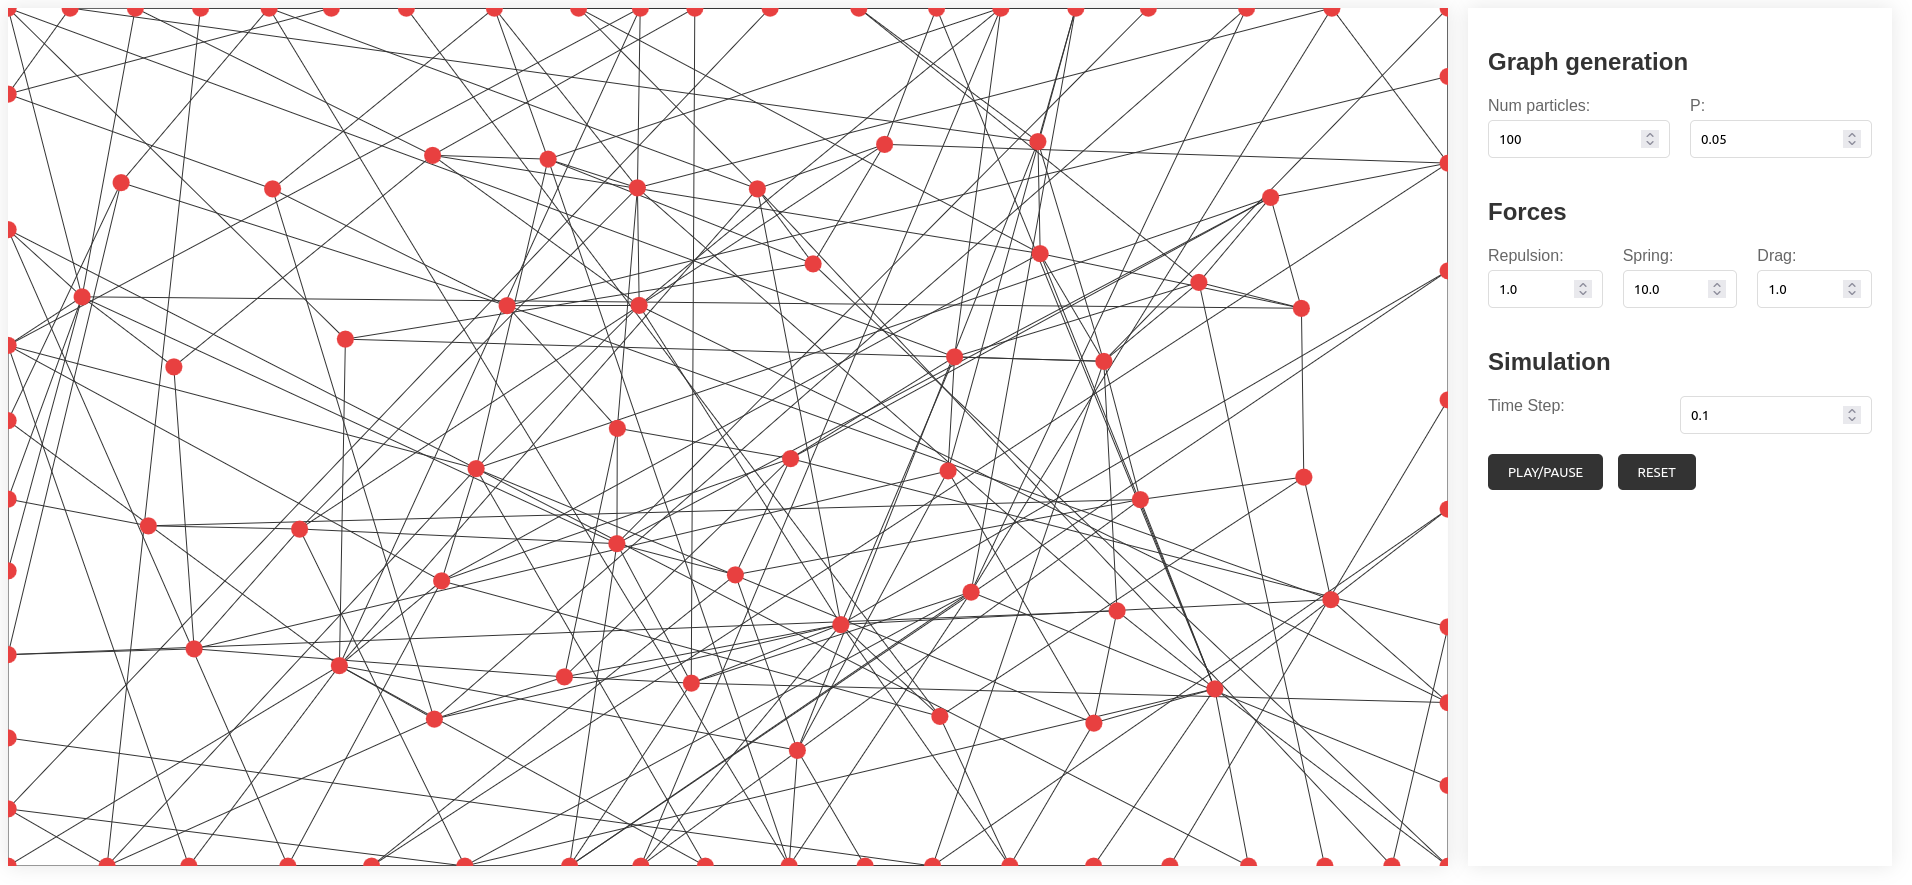
An interactive JavaScript visualizer of the construction of force-directed layouts for random graphs.

Graphs are generated randomly following the Erdős-Rényi model, where a set of N nodes is initialized, and each of the N(N-1) possible edges are created with probability P.
Nodes are initialized at random positions, which usually results in a lot of clutter. A simple and visually-pleasant way of drawing the graph is a force-directed layout, in which a set of forces is simulated to move the nodes towards certain positions; the simulation often converges in a state where the graph is easier to visualize and interpret.
There are two types of forces at play:
- Repulsion forces between all nodes, that behave as electrically charged particles following Coulomb’s law.
- Spring-like attraction forces between adjacent nodes in the graph (linked with an edge).
Additionally, I constrain all nodes to be within the screen canvas (bouncing at the borders) and I allow for user interaction, to move nodes with the mouse.
In this program, I run such a simulation in real time to see how it evolves, and how different user-defined hyperparameters affect the convergence speed and final result.
